
Ethereum price dropped nearly 18% over the past week as U.S. Ether ETFs logged six straight days of outflows that seem to be weighing on investor sentiment. A bearish reversal pattern on the daily chart now flags the risk of more losses ahead.
Summary
- ETH price dropped nearly 18% over the past week.
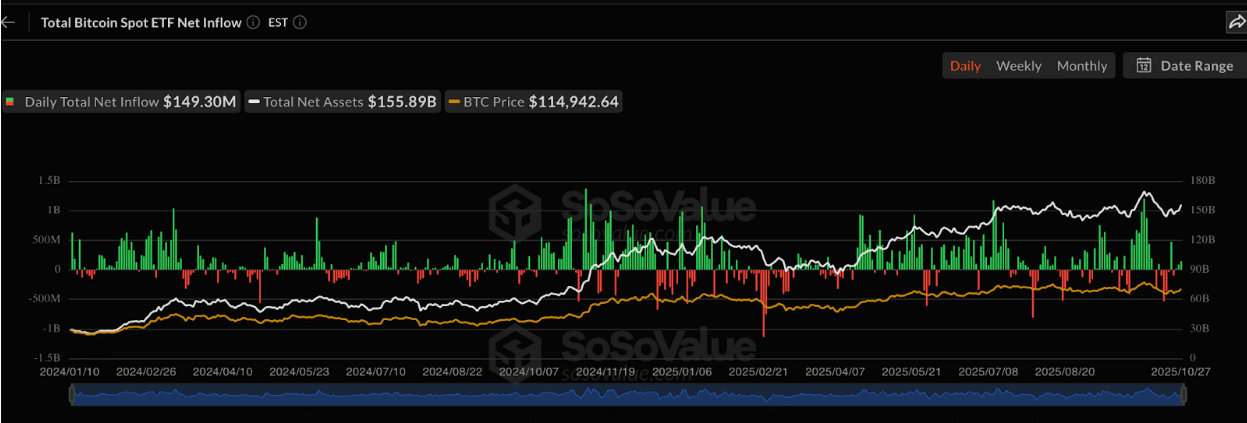
- U.S. Ether ETFs recorded $630 million in outflows over a six-day outflow streak.
- Multiple bearish patterns have formed on the daily chart.
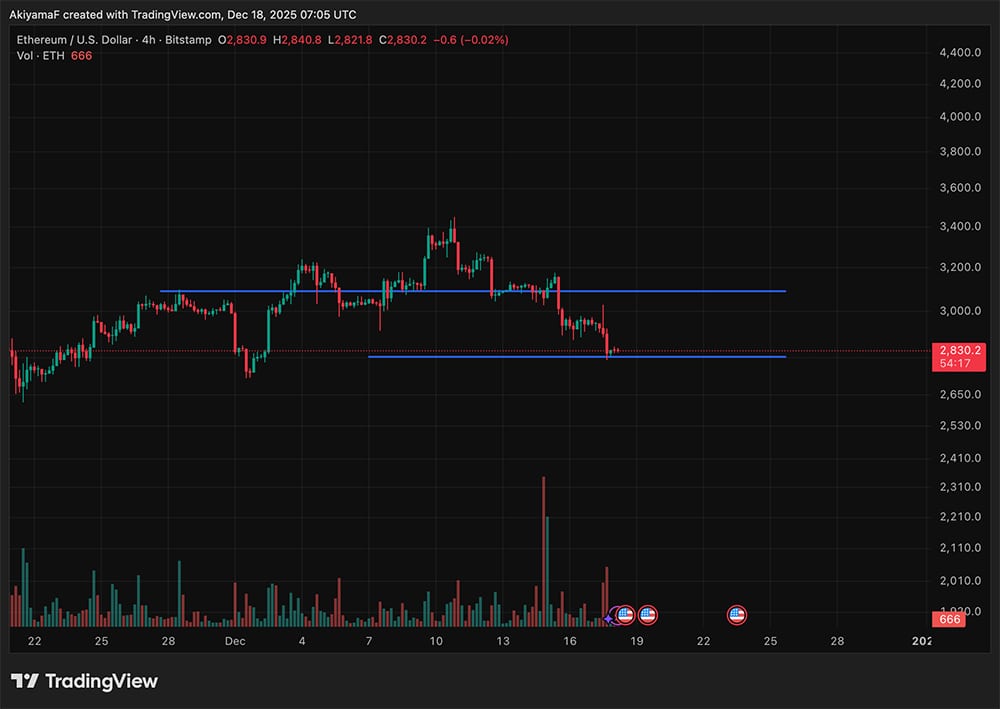
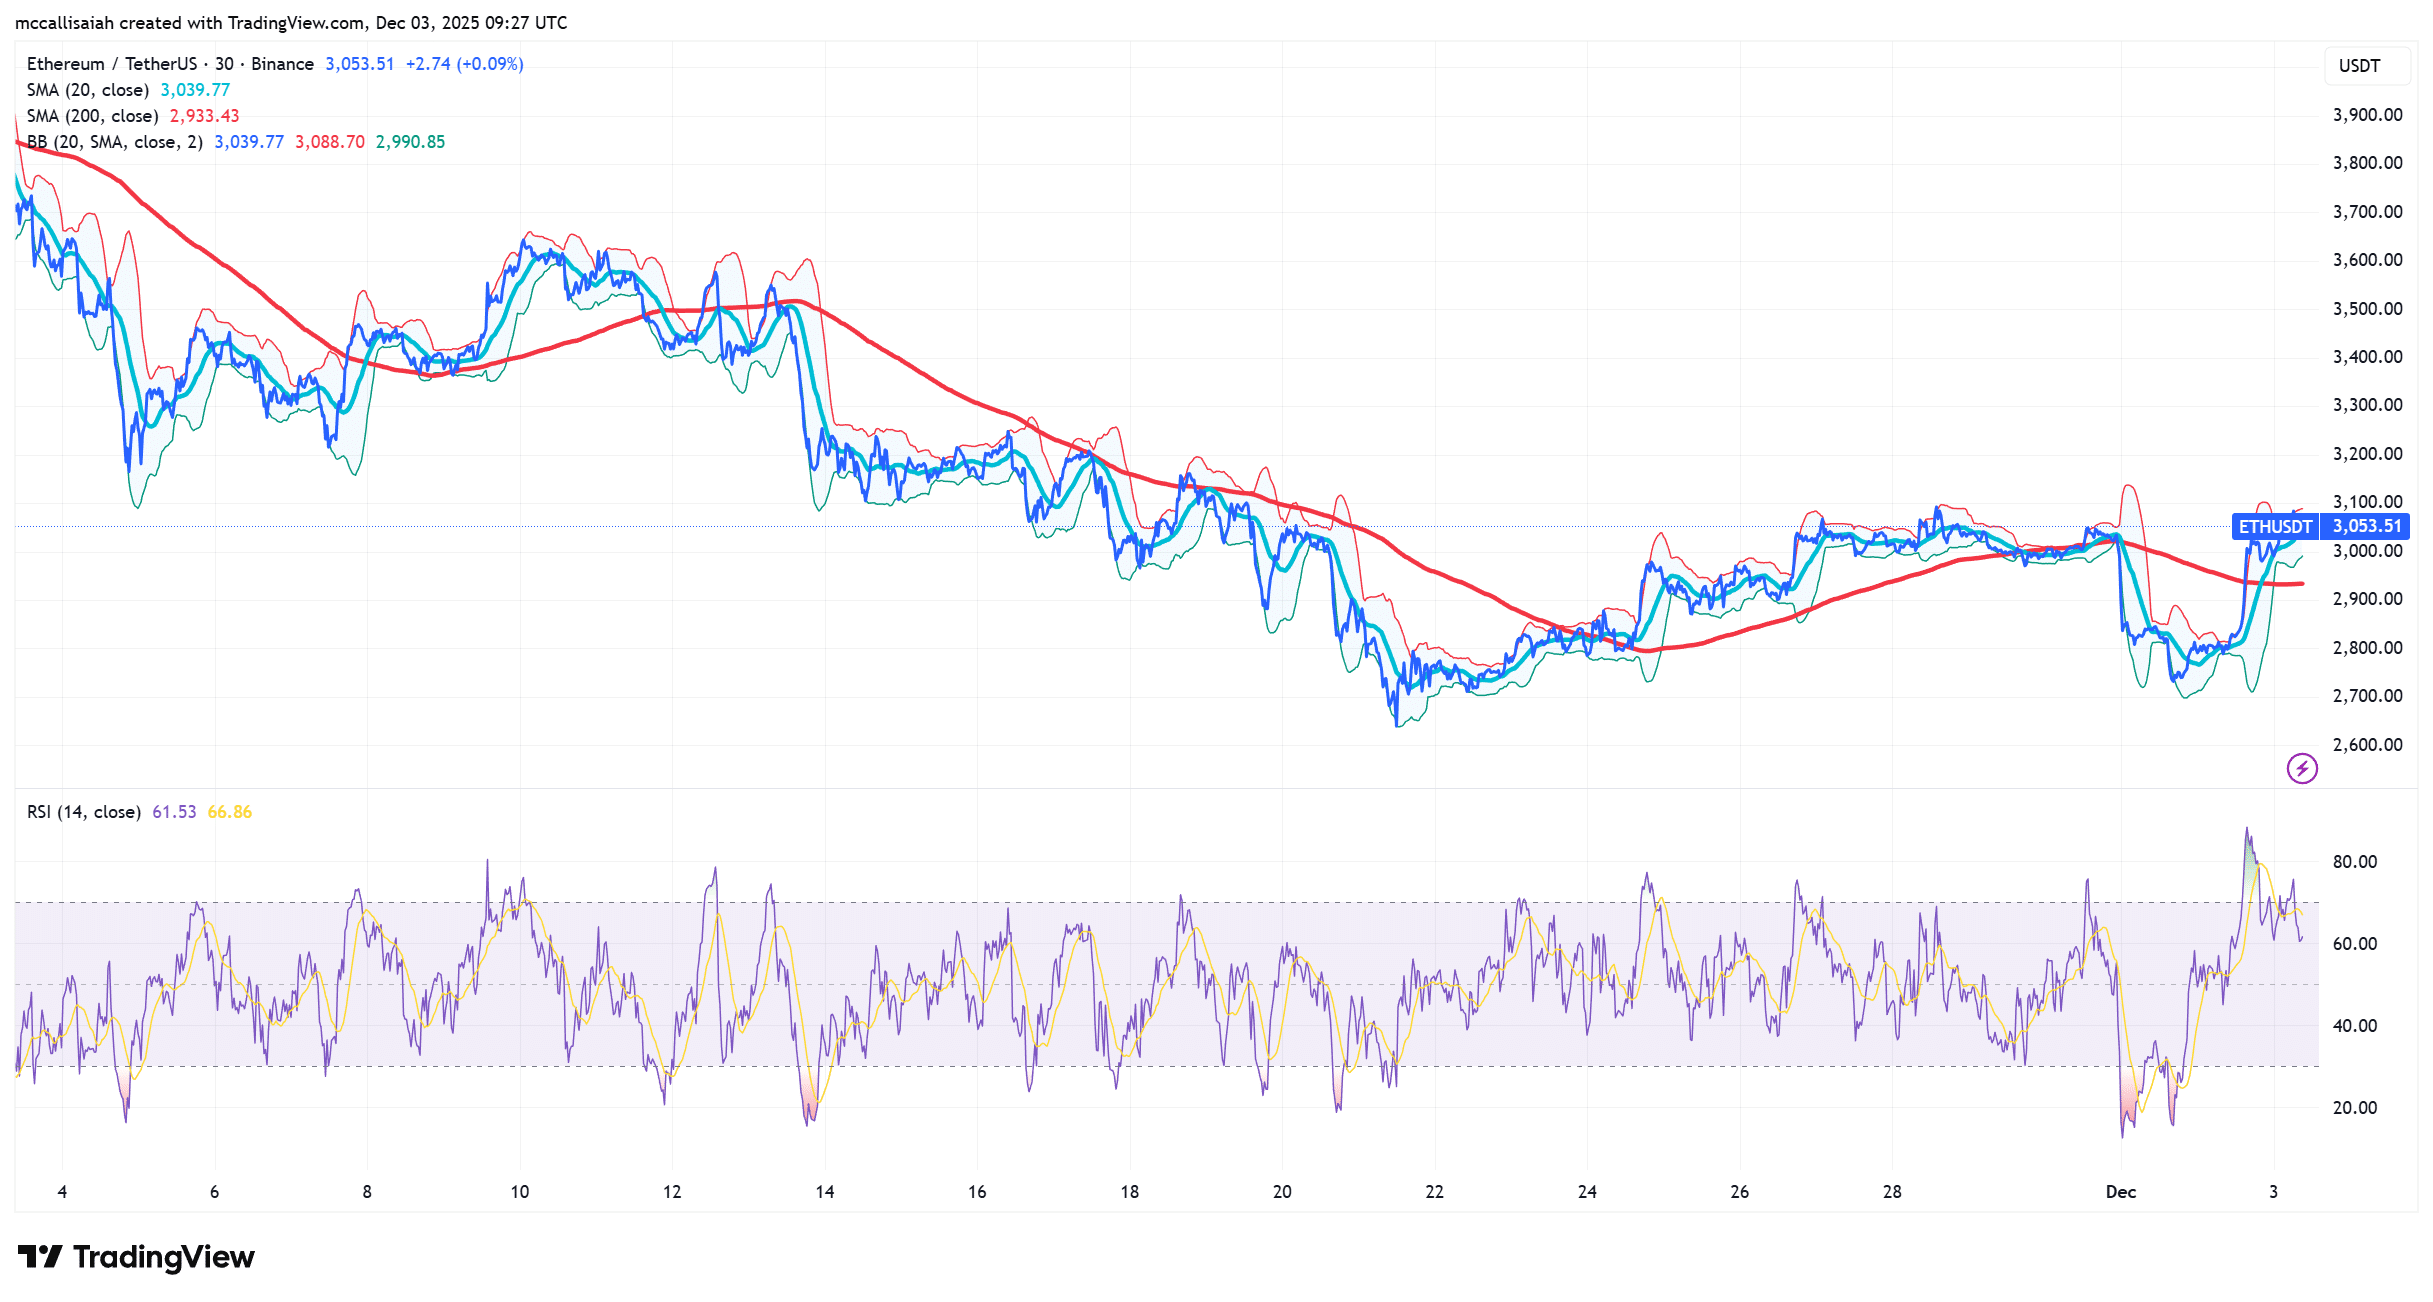
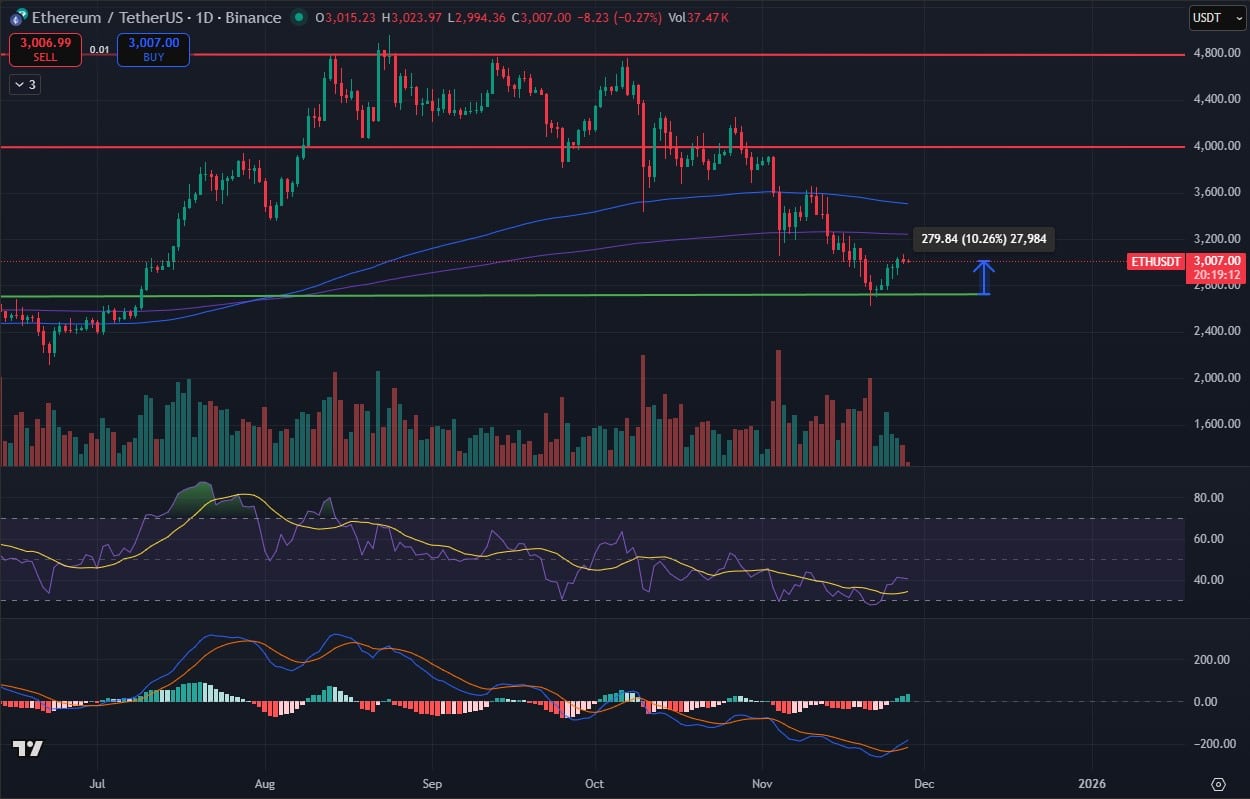
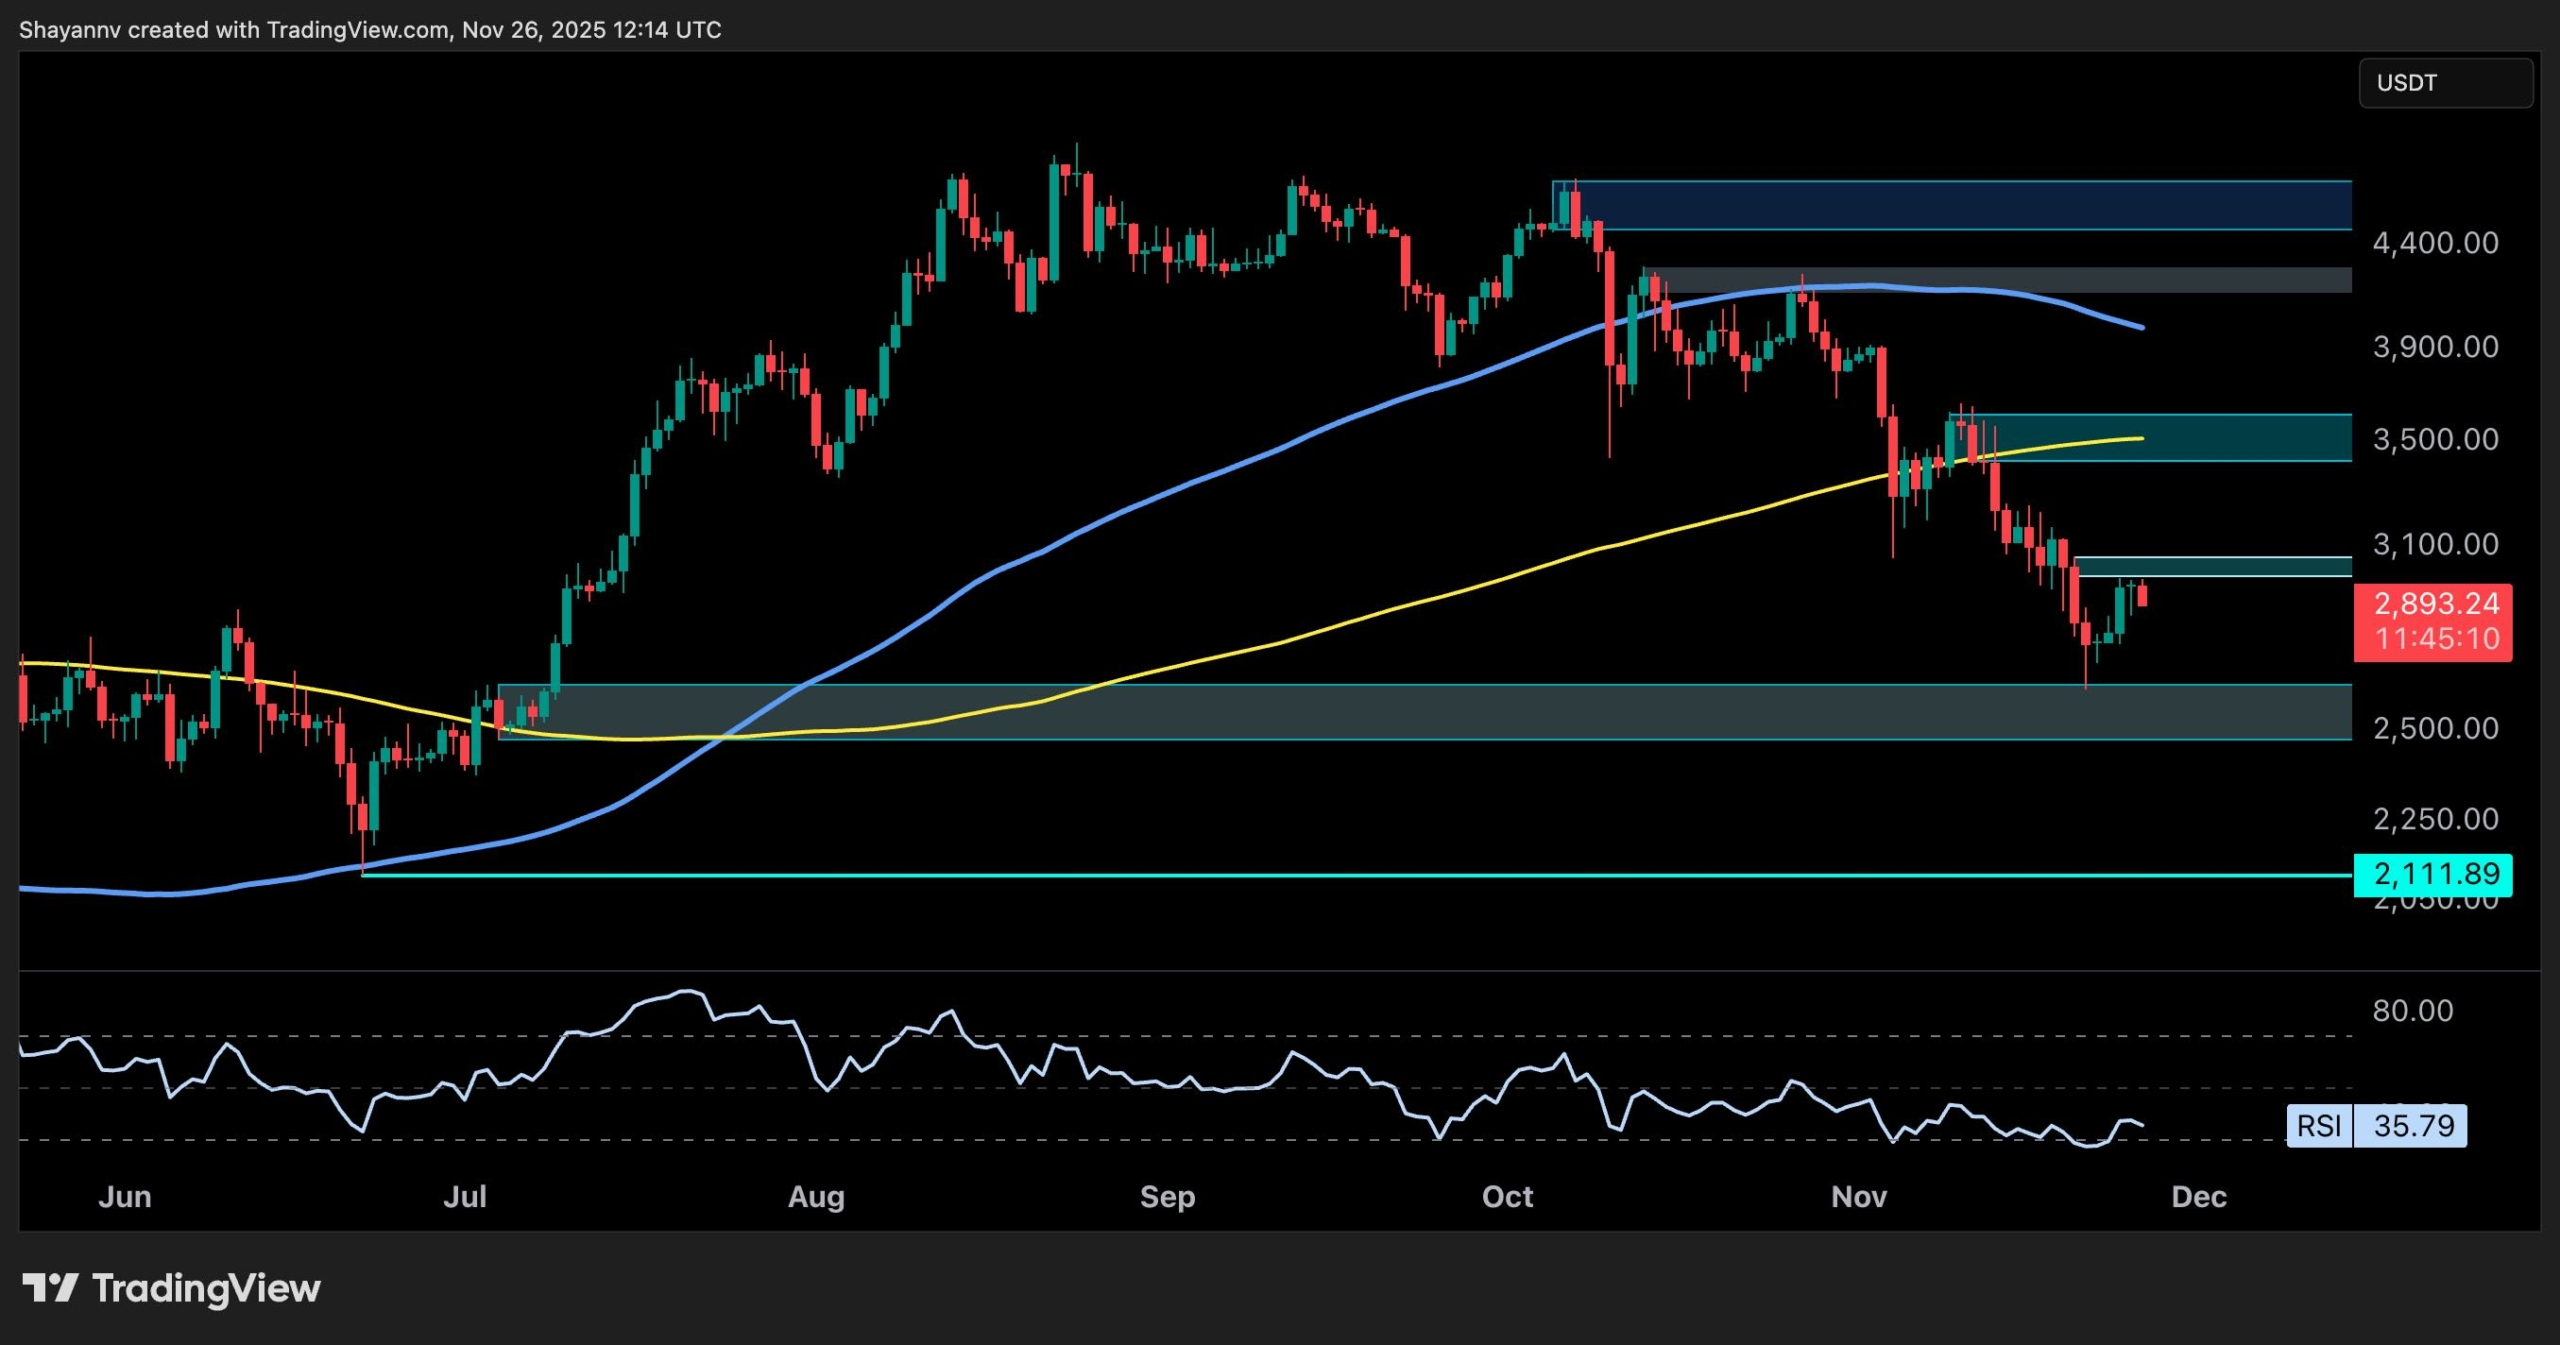
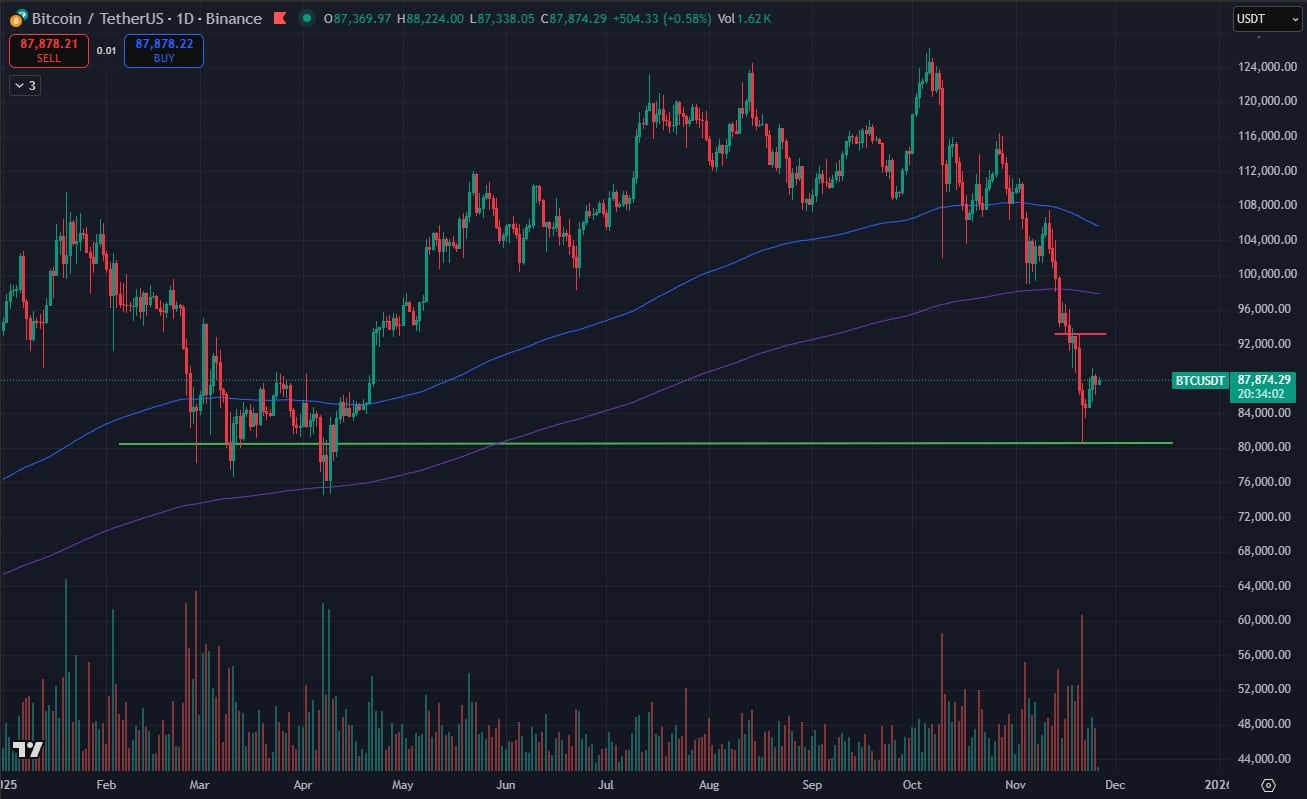
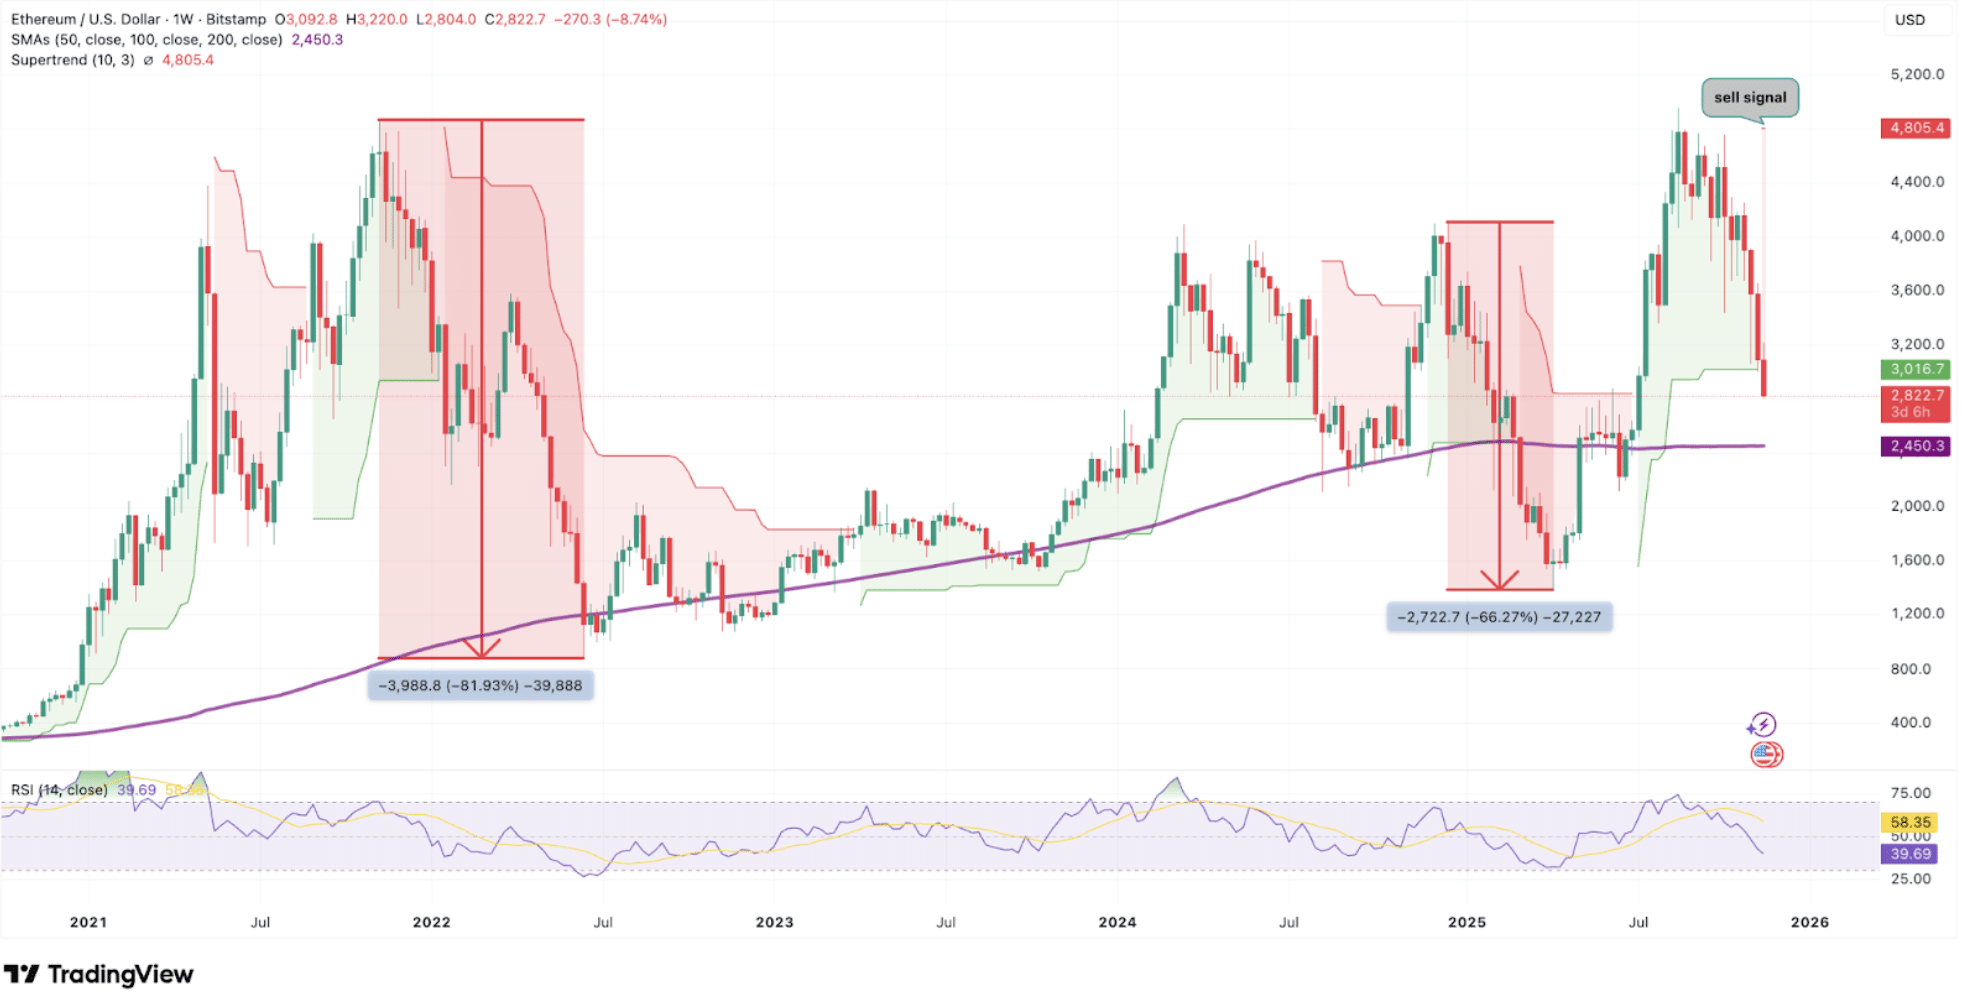
According to data from crypto.news, Ethereum (ETH) price dropped to an intraday low of $2,781 on Friday, Dec. 19, down 18% from last week’s high of $3,390 and 39% below its yearly peak.
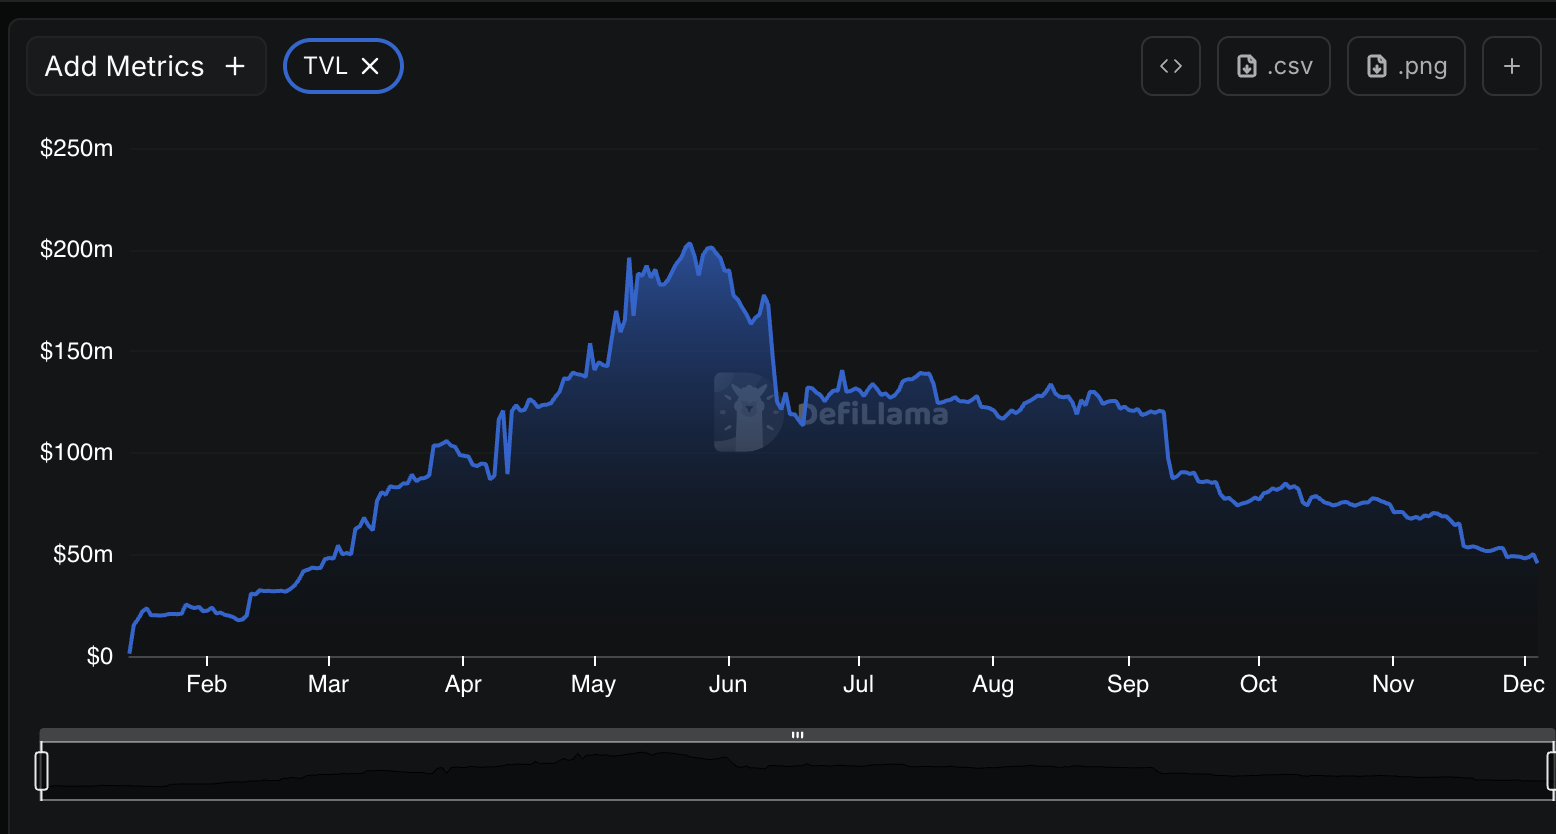
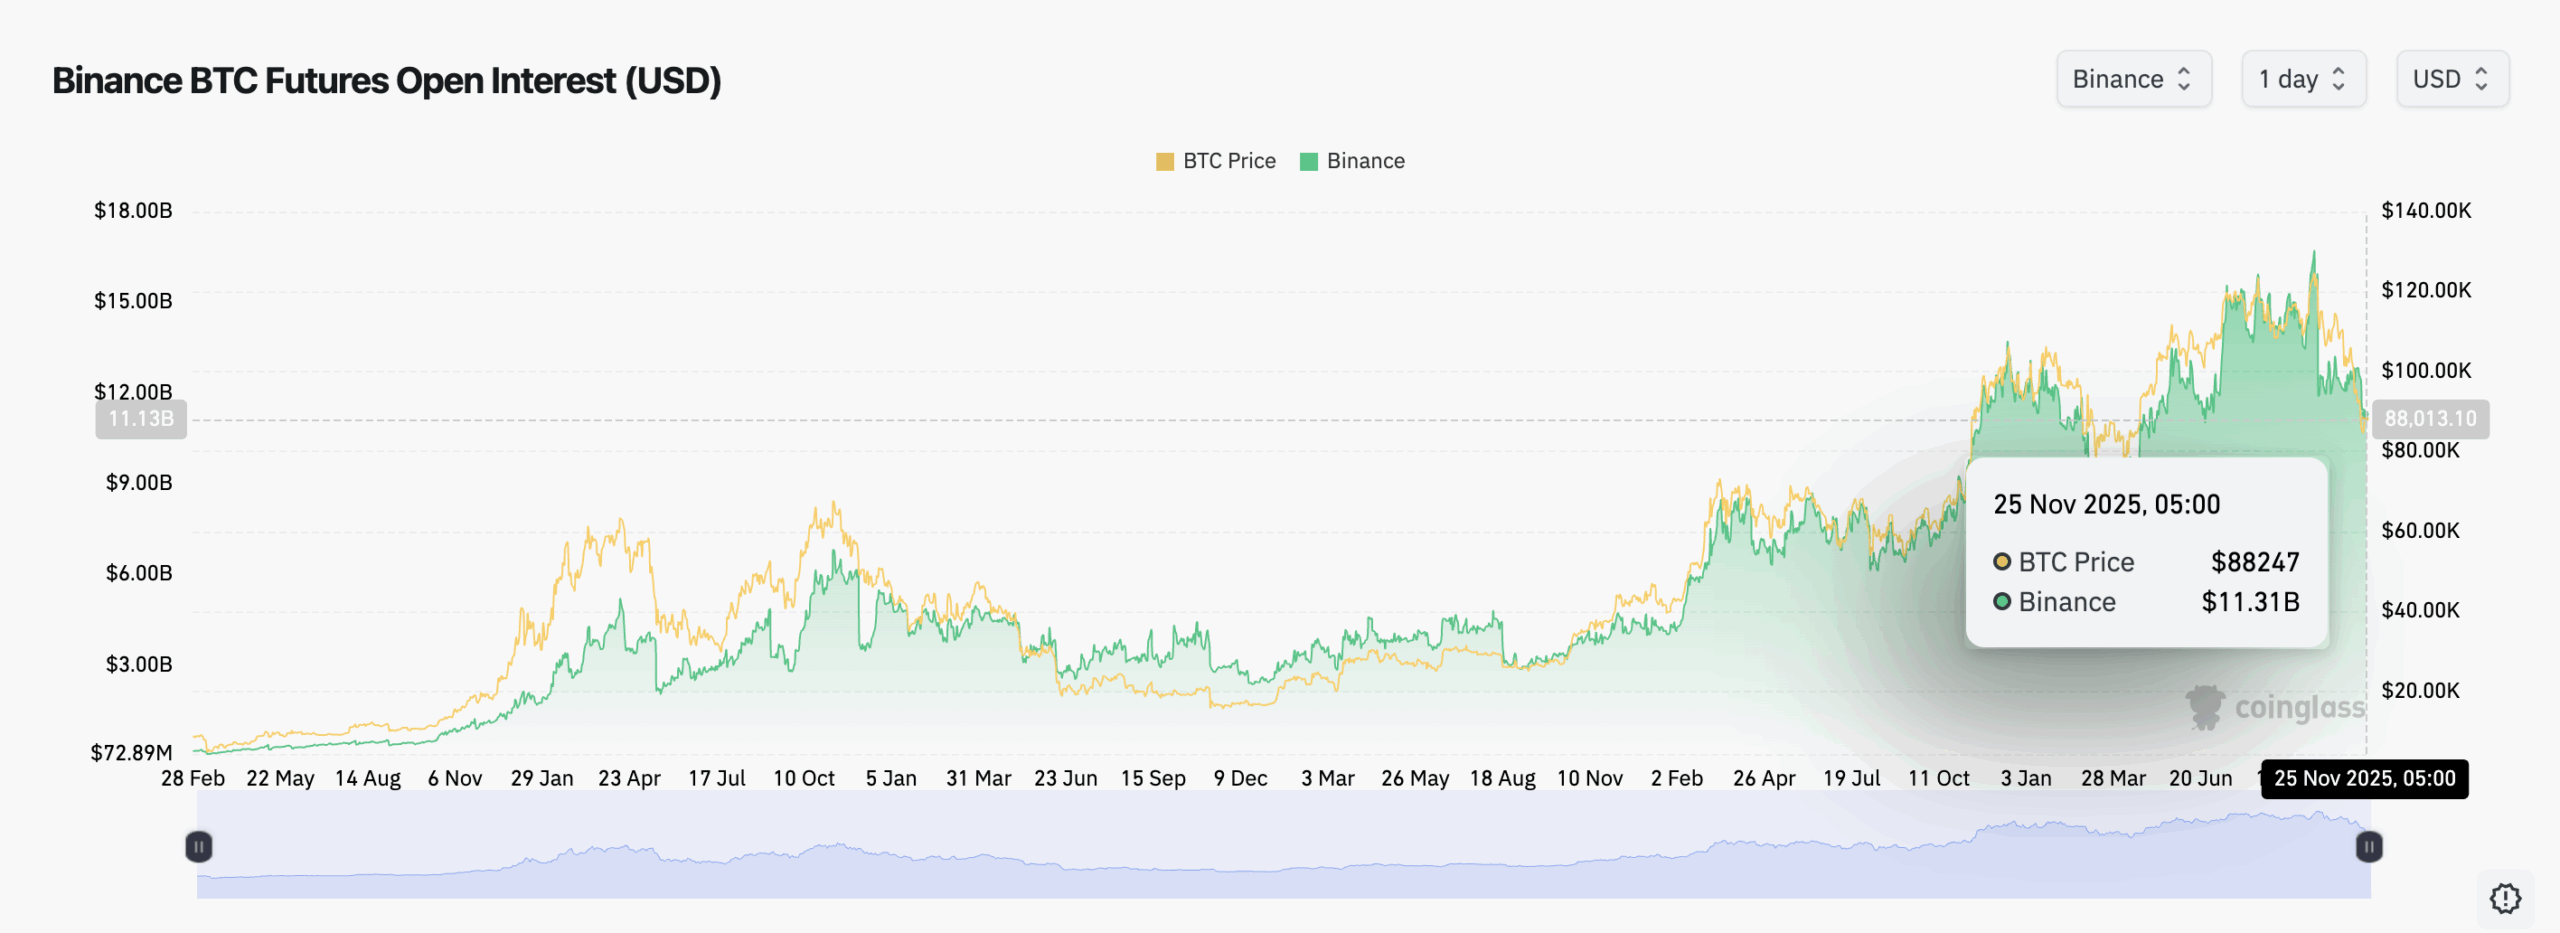
Ethereum price dropped amid waning demand for its spot ETFs among institutional investors. According to data from SoSoValue, U.S. spot Ether ETFs experienced net outflows for six consecutive days, totaling $630 million shed by the funds. Such continuous outflows from these institutional products tend to dampen investor appetite and often instill more selling pressure on the asset.
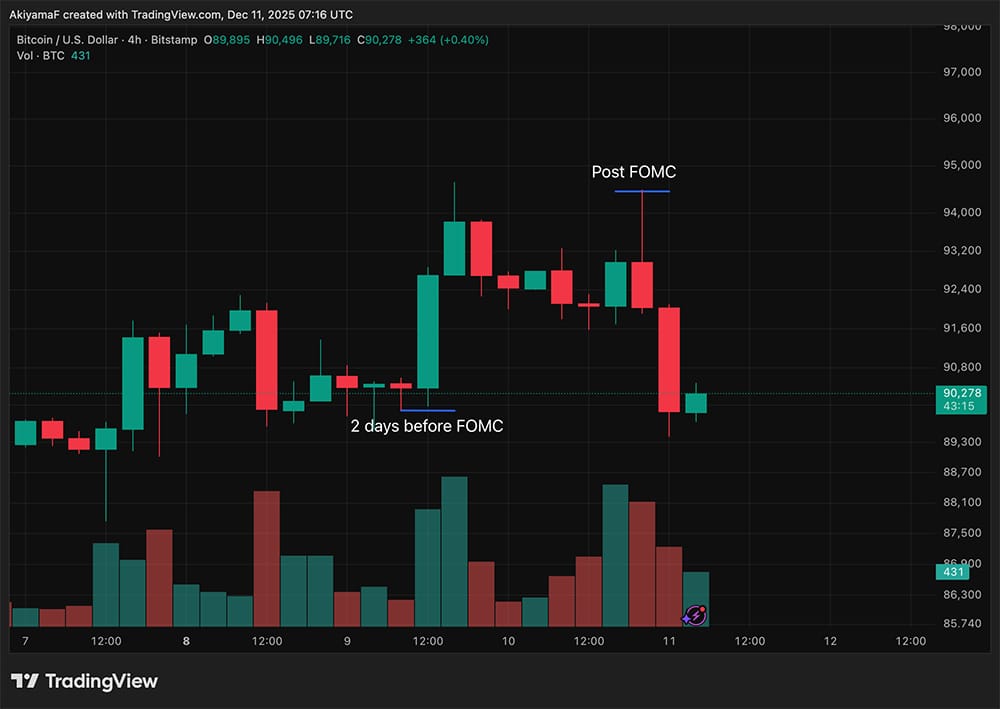
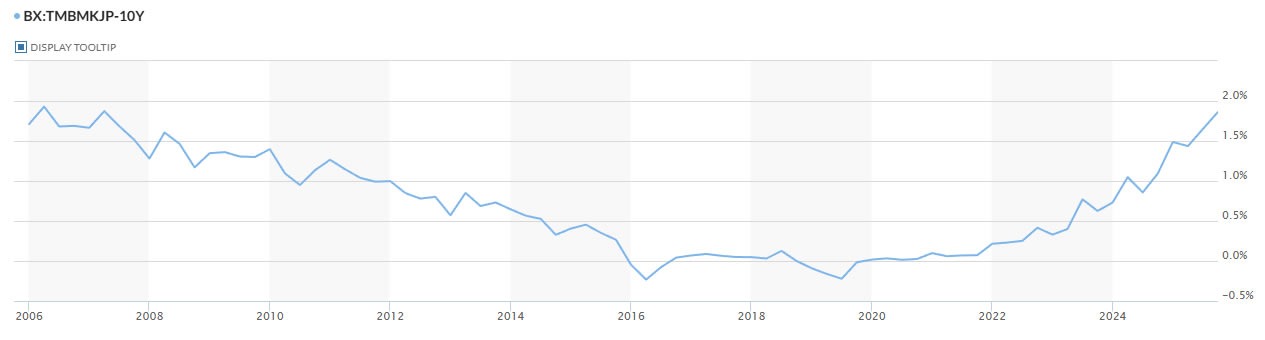
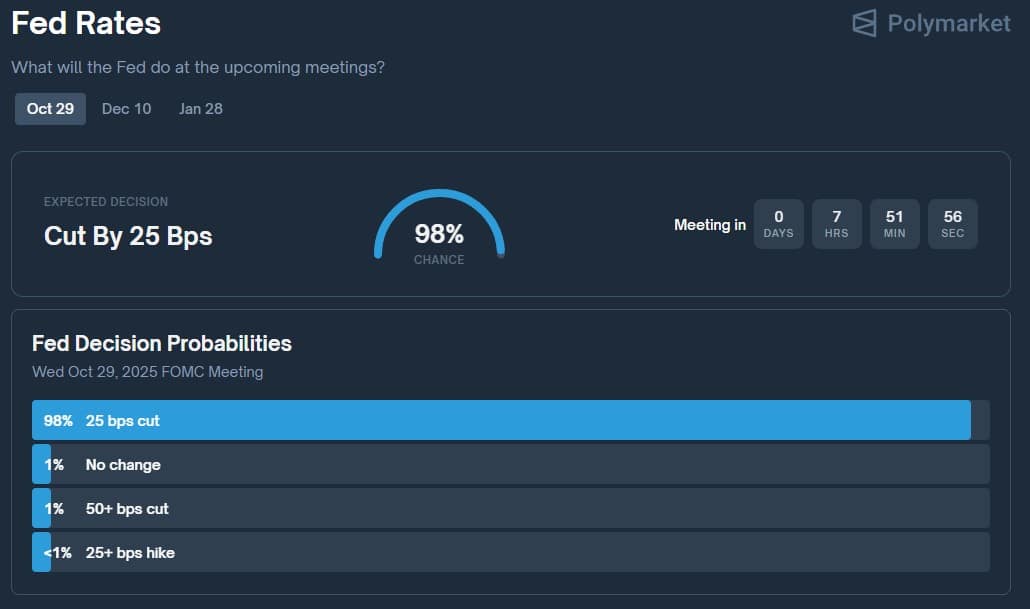
Broader macroeconomic factors, including the Fed’s recent hawkish tone surrounding lesser rate cuts in early 2026 and the Bank of Japan’s decision to increase interest rates by 0.25% to 0.75%, its highest in 30 years, have also kept investors at bay from crypto assets, including Ethereum.
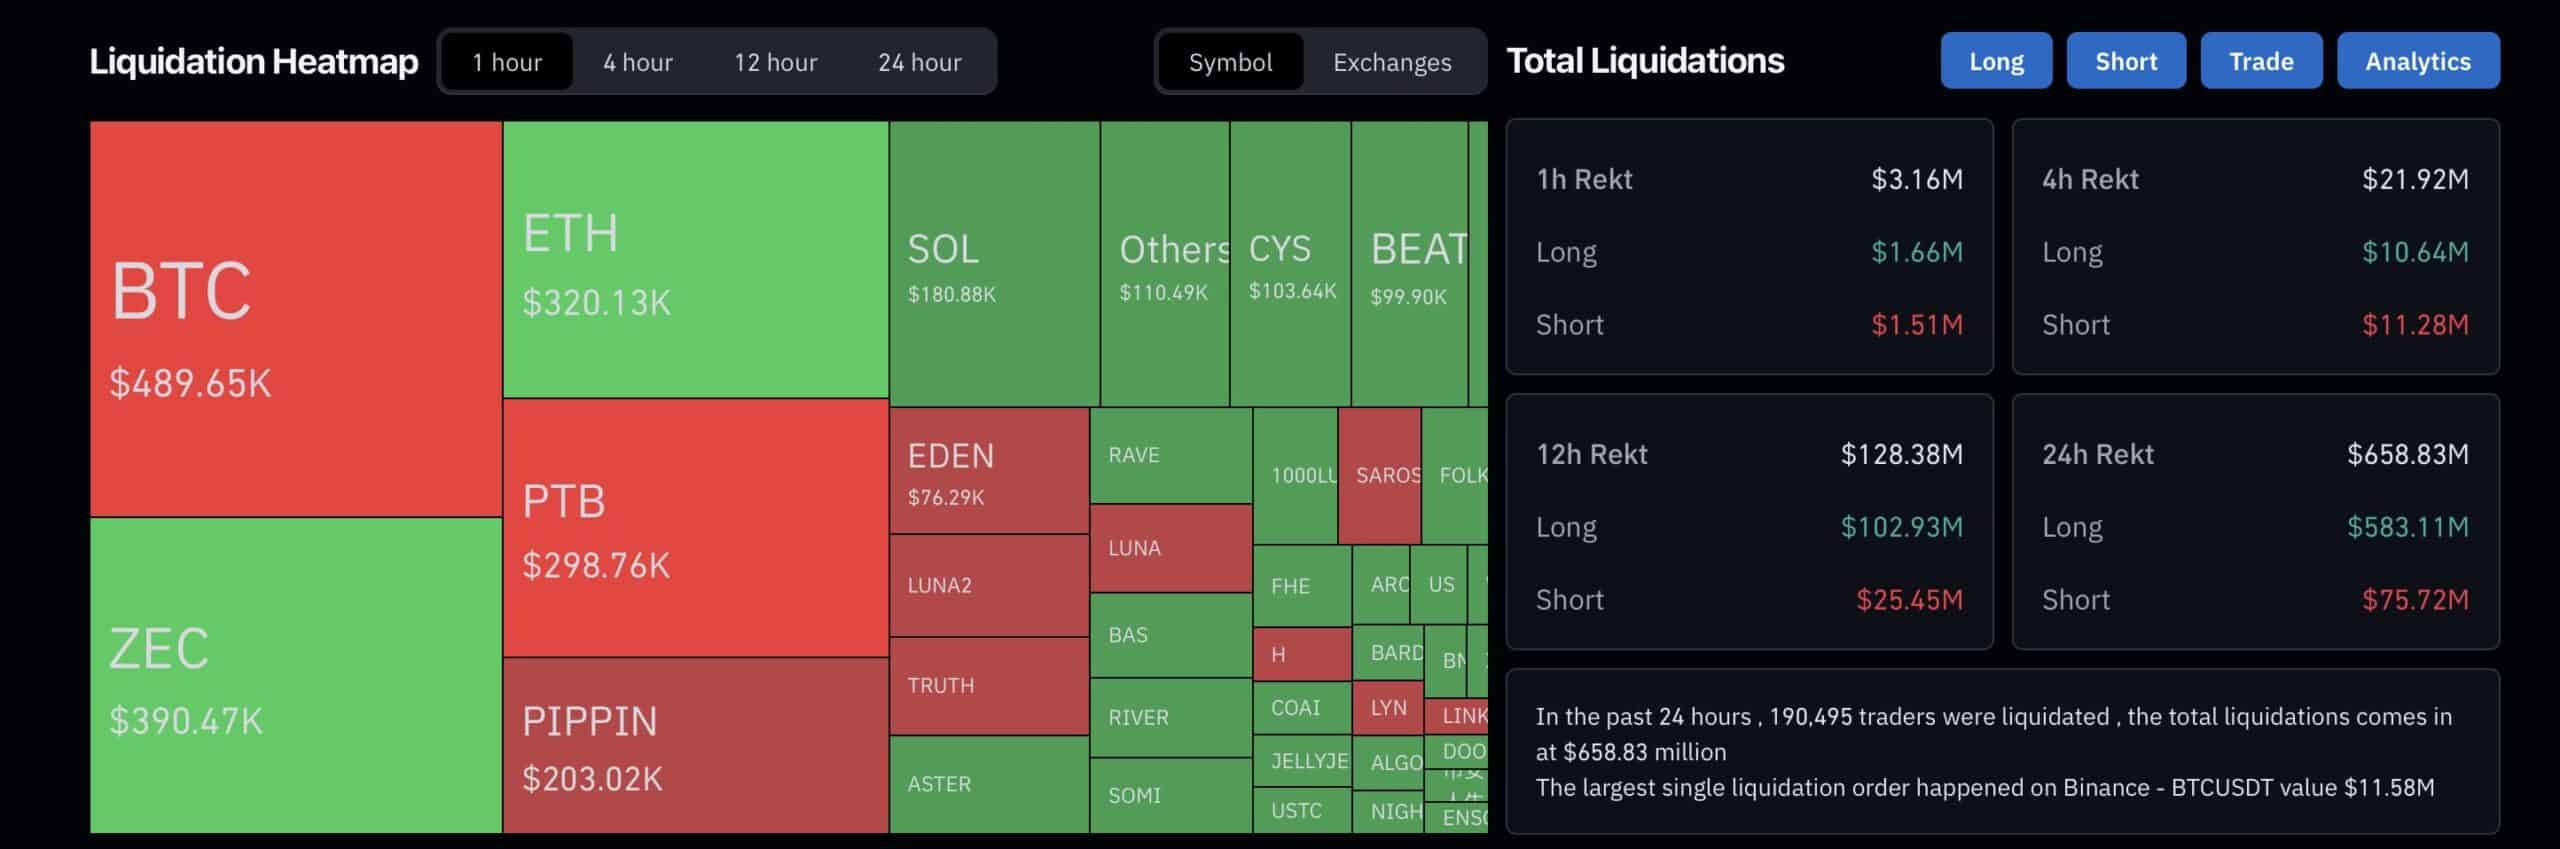
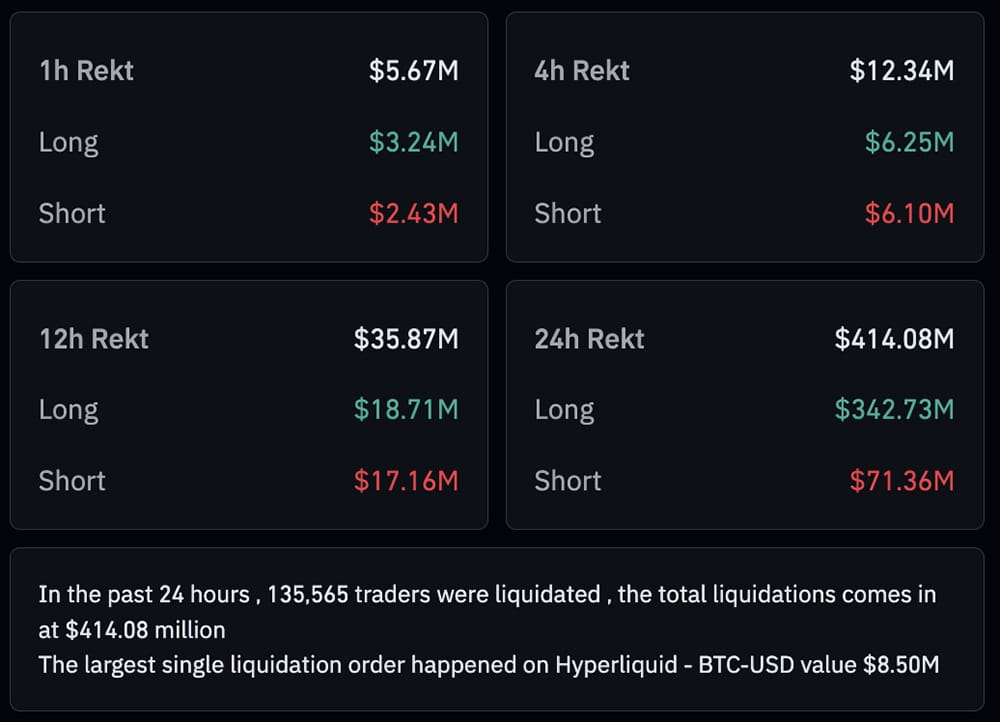
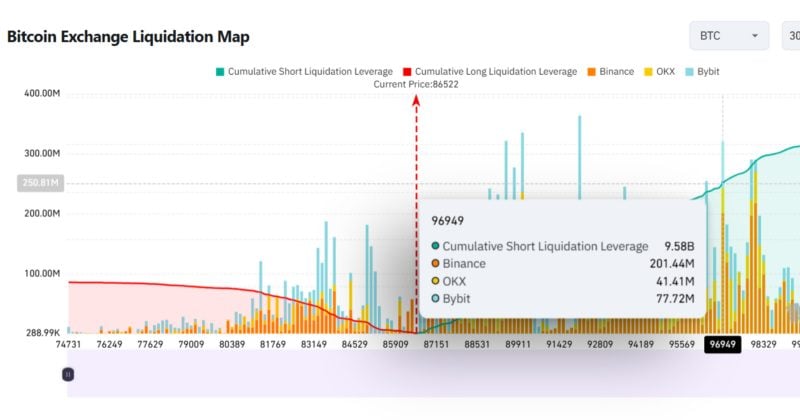
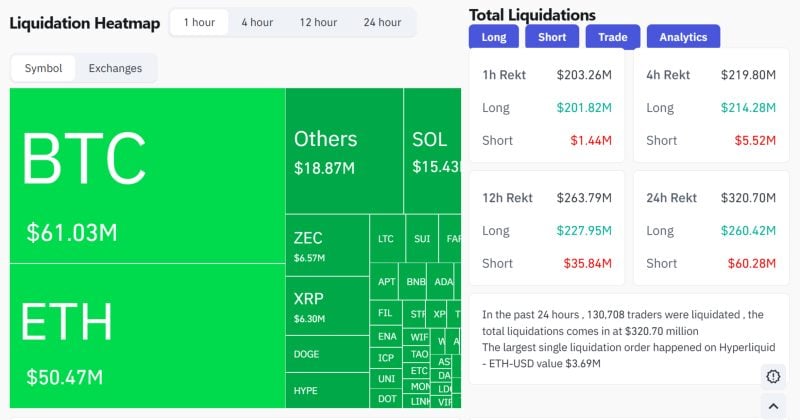
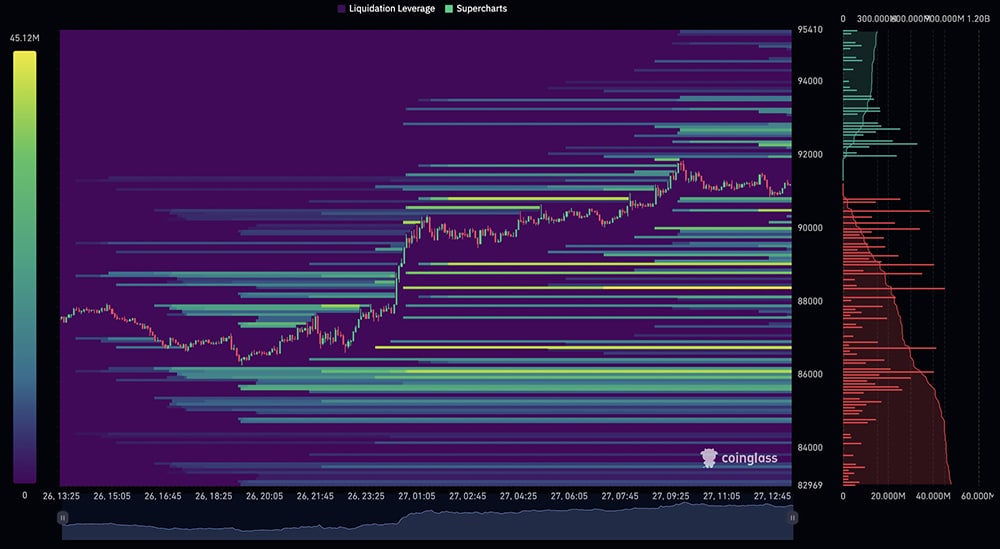
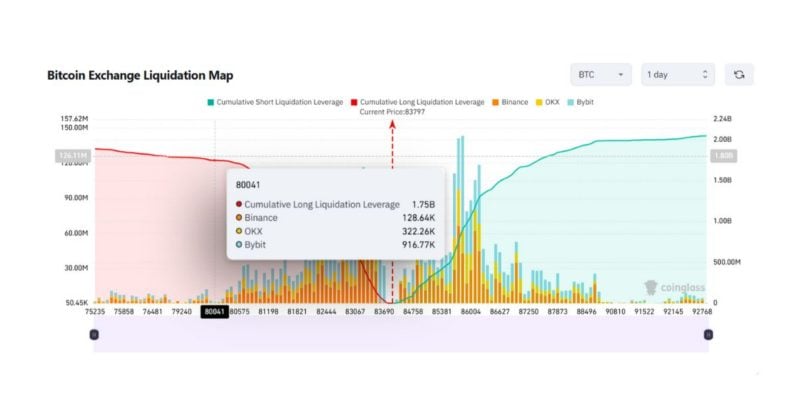
ETH price is also facing pressure from the liquidation of highly leveraged traders in its derivatives market. Data from CoinGlass shows that nearly $158 million worth of positions were liquidated over the past 24 hours, adding further downward pressure on price.
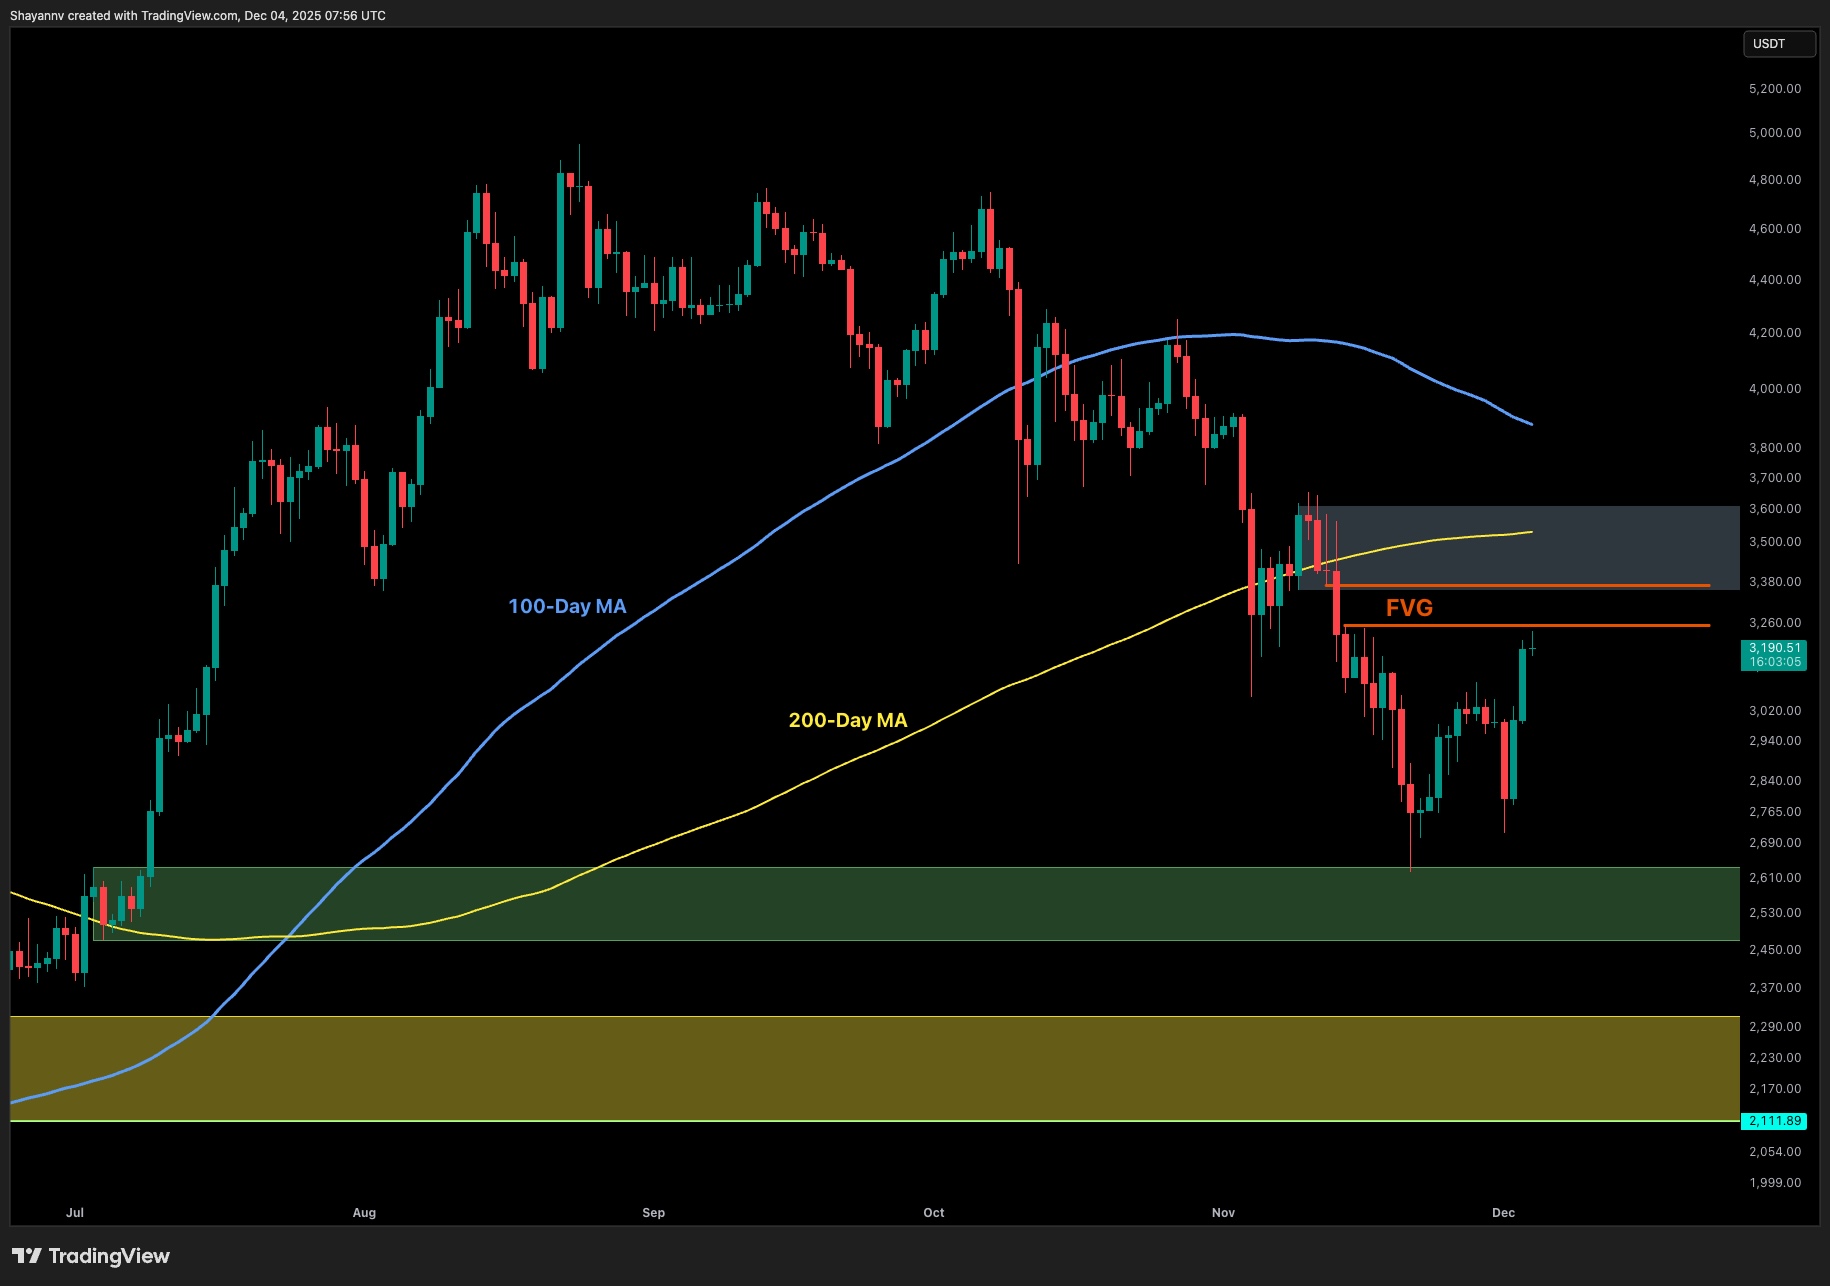
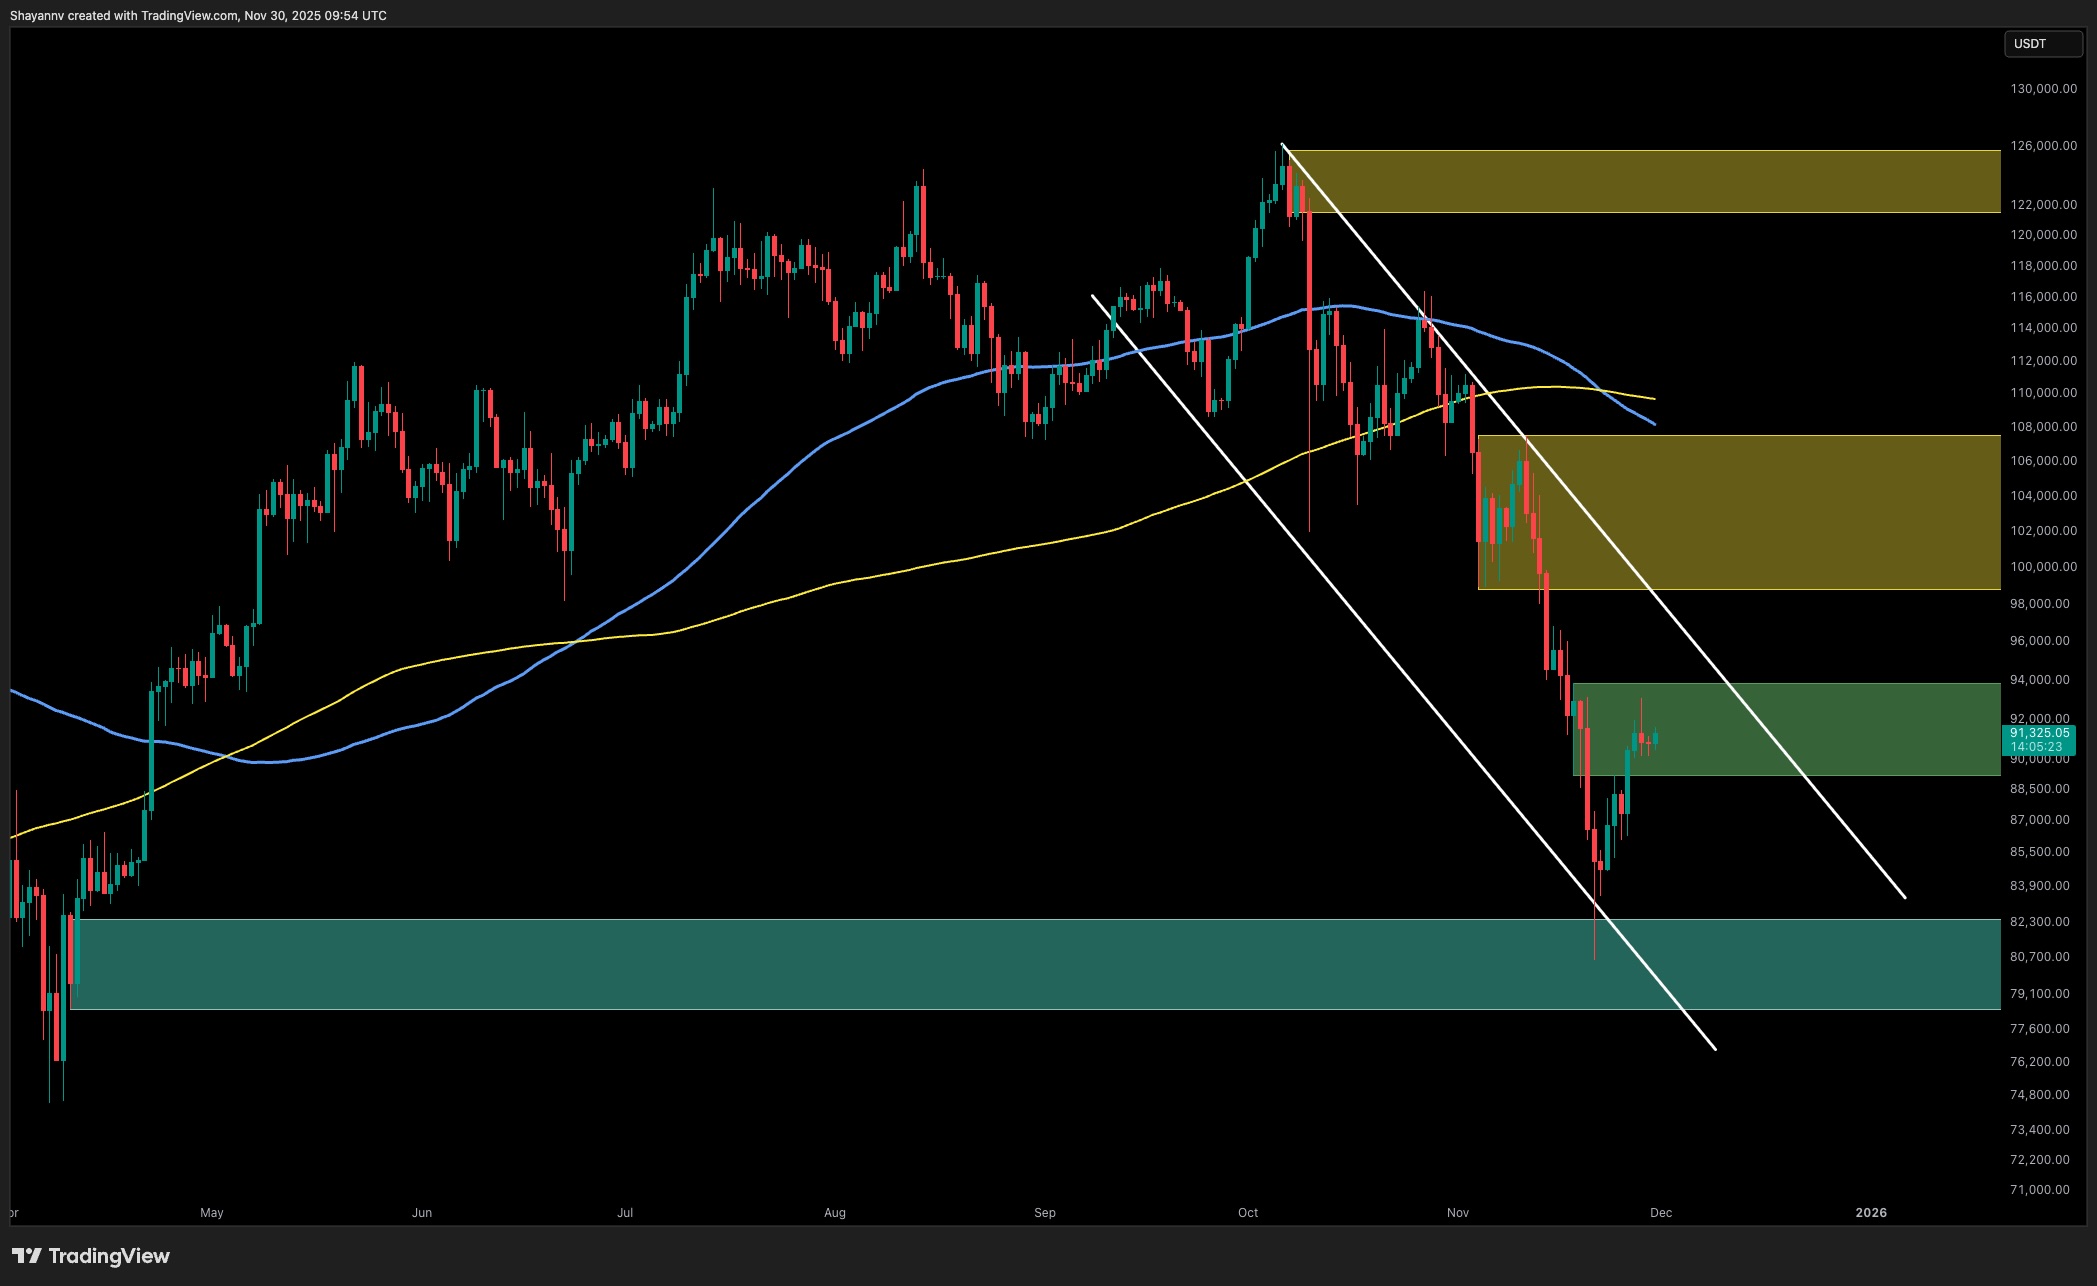
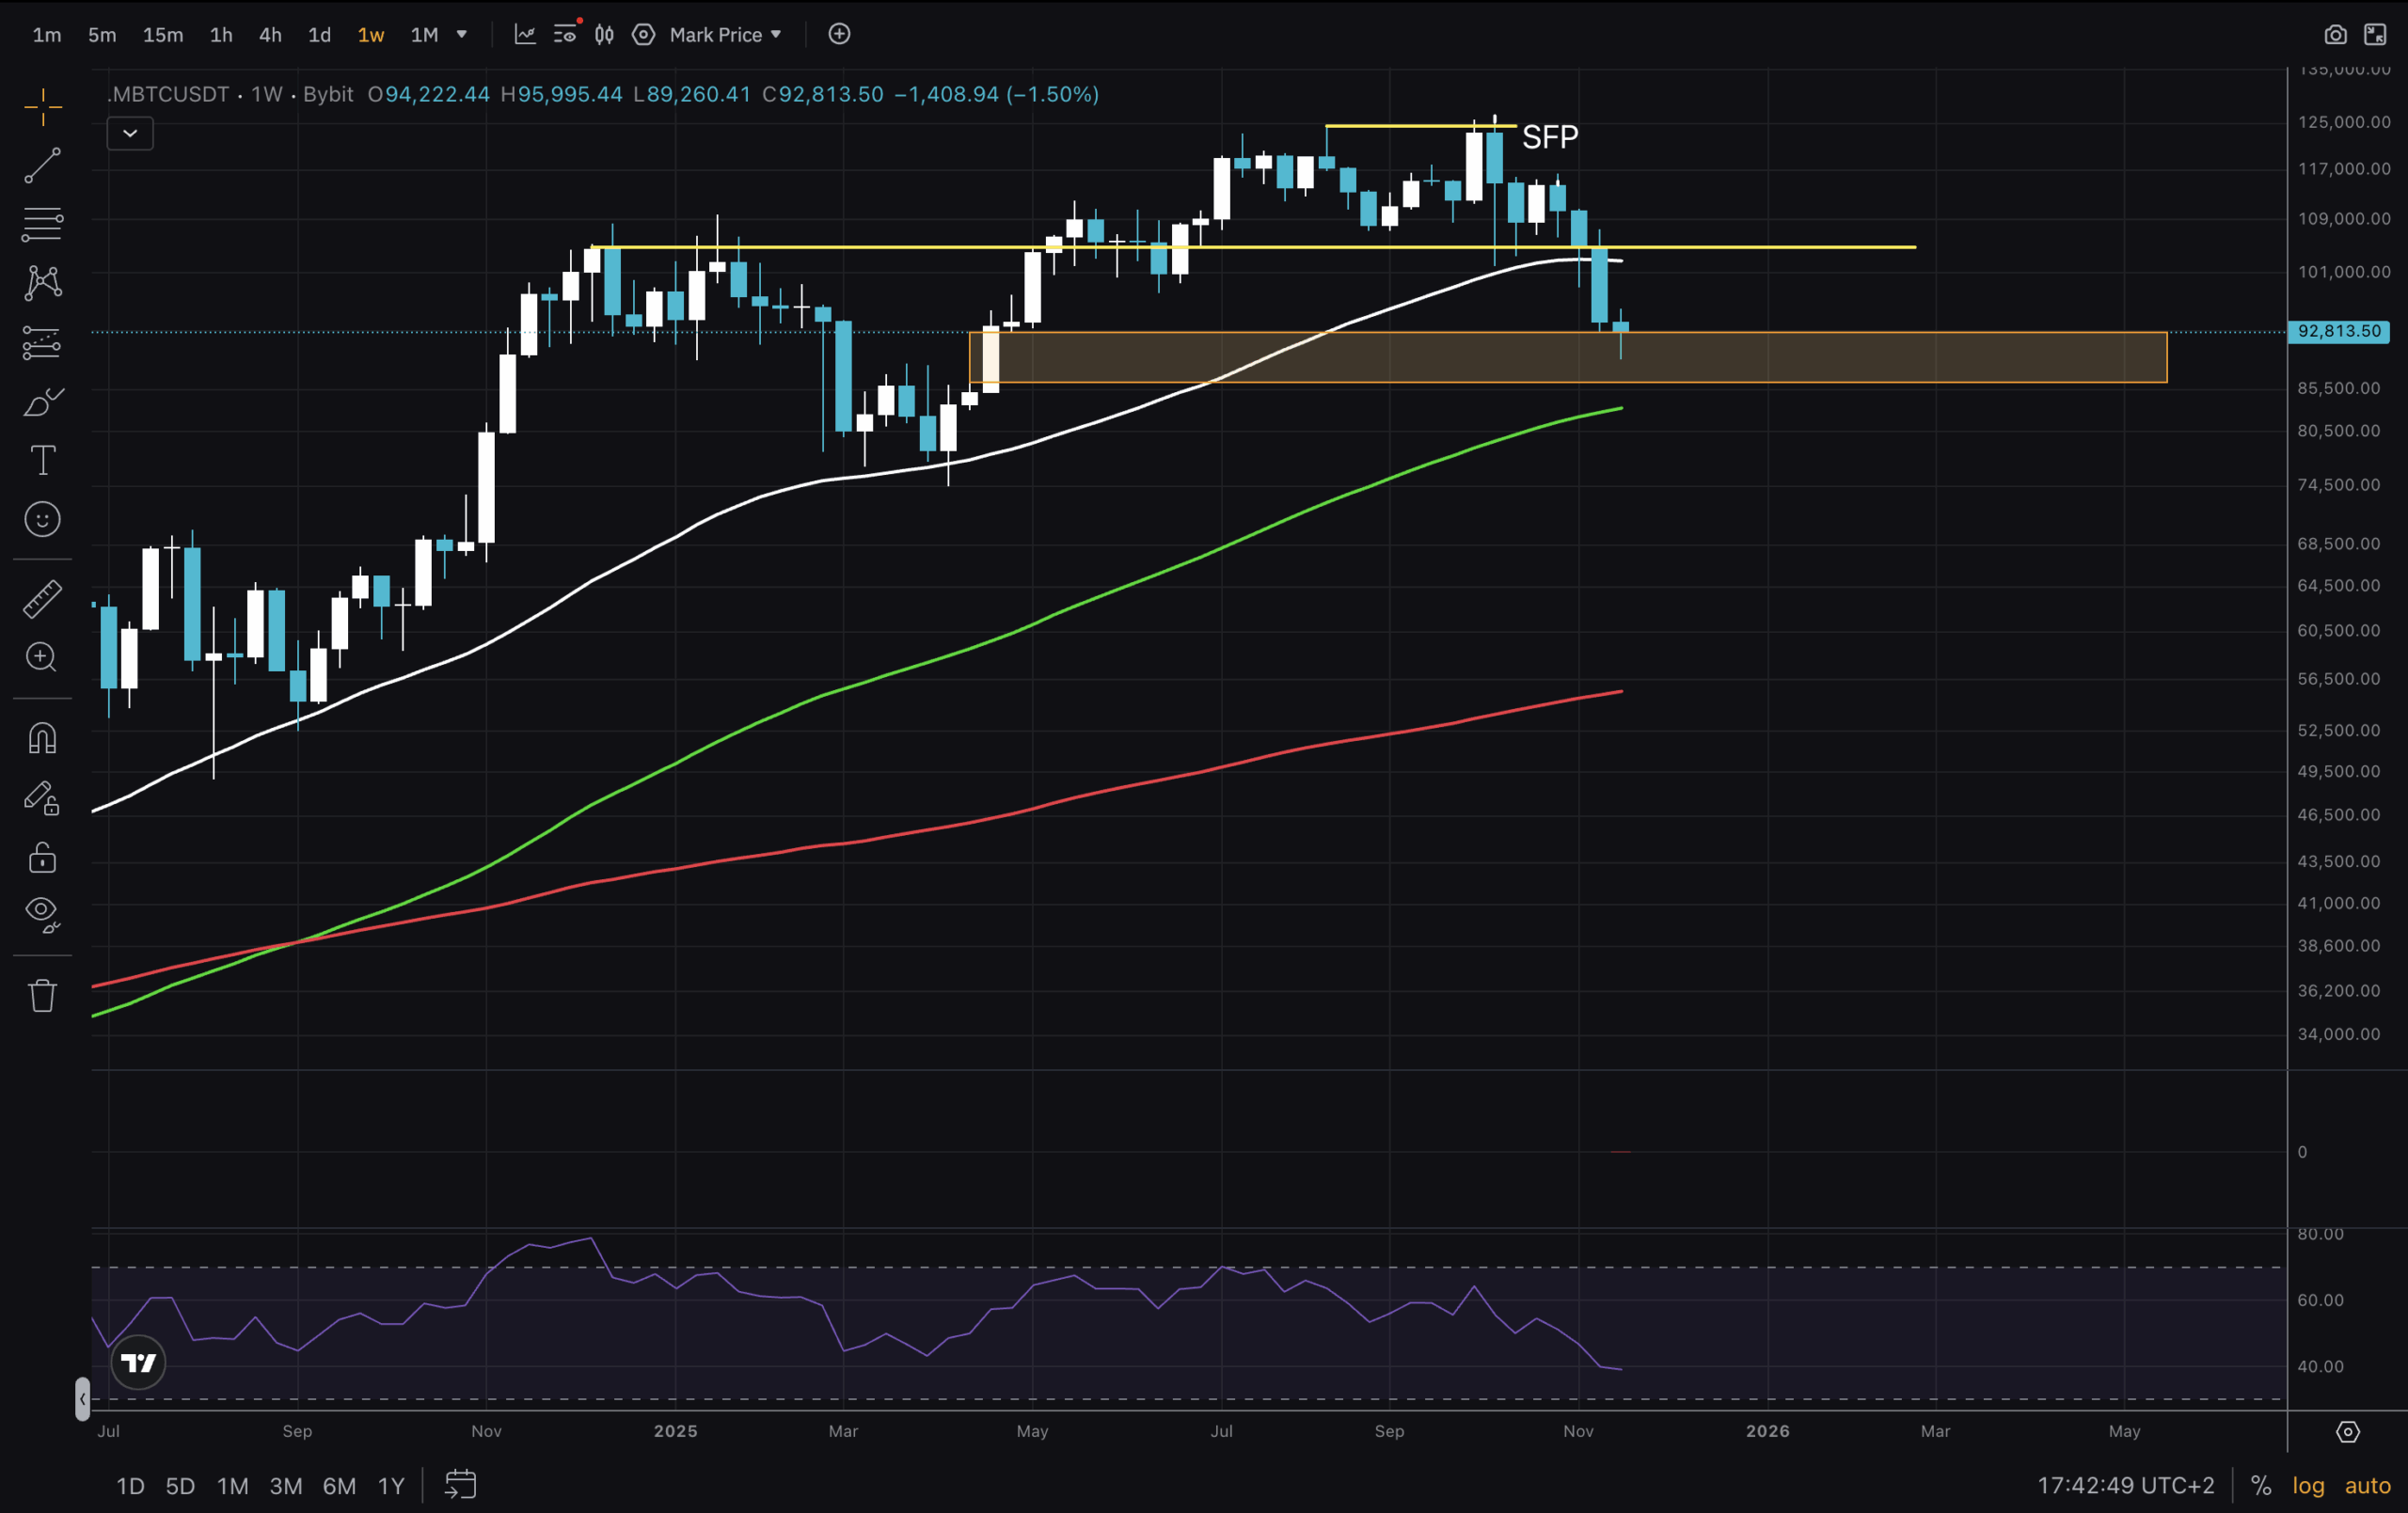
Ethereum price has formed an ascending broadening wedge pattern for over four weeks, marked by higher highs and higher lows, with bears starting to reassert pressure. A breakdown from such a pattern is typically seen as a signal for a bearish trend reversal in the days ahead.
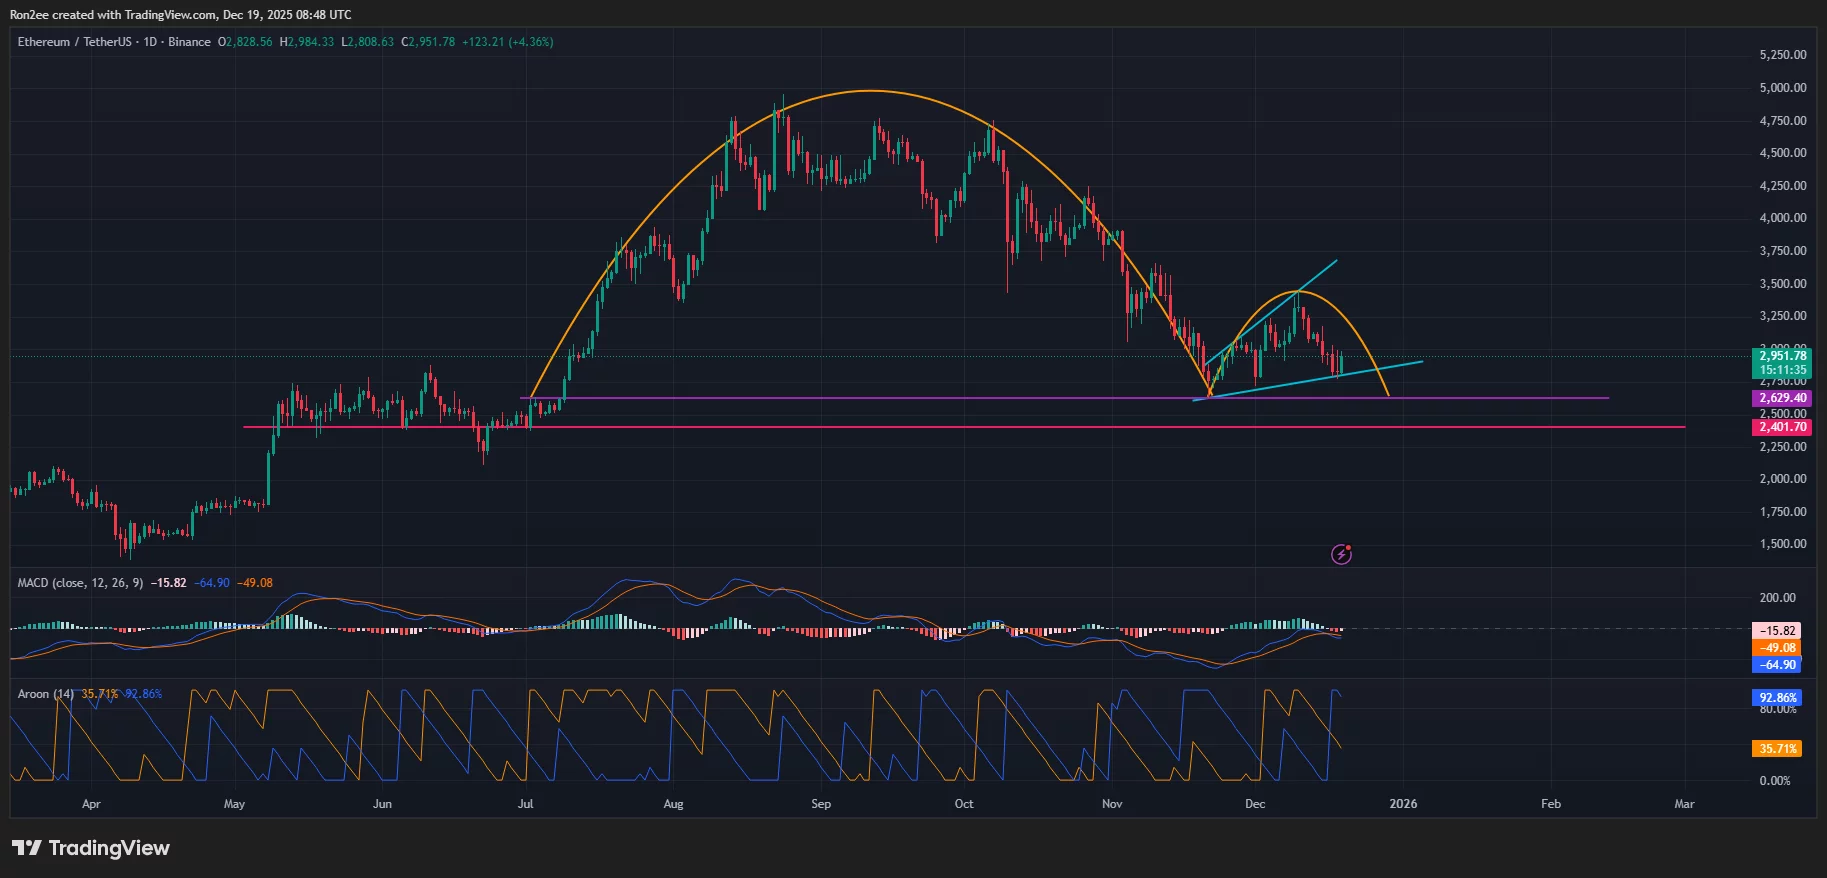
At press time, ETH was close to a breakdown below the lower trendline of the pattern. If this trendline breaks, it could lead its price to fall below $2,629, a level that acts as the neckline of an inverse cup and handle pattern. It is a larger bearish structure formed over multiple months and implies the downtrend may continue.
Technical indicators are also flashing bearish signs. For instance, the MACD lines were trending downwards, a sign that the downtrend has not yet lost momentum. Meanwhile, with the Aroon Down surging to 92.86% and the Aroon Up languishing at 35.71%, technical data confirms that downward momentum continues to dictate market direction.
For now, $2,629 is the key level to watch. Failure to hold this could lead ETH price to drop to $2,400 next. The said level has acted as a strong floor for ETH throughout this year, and losing it may open the door to further downside.
Disclosure: This article does not represent investment advice. The content and materials featured on this page are for educational purposes only.